
Platform health in one view
One verdict tells you whether the platform can proceed, without leaving the product to stitch together three separate infrastructure views.
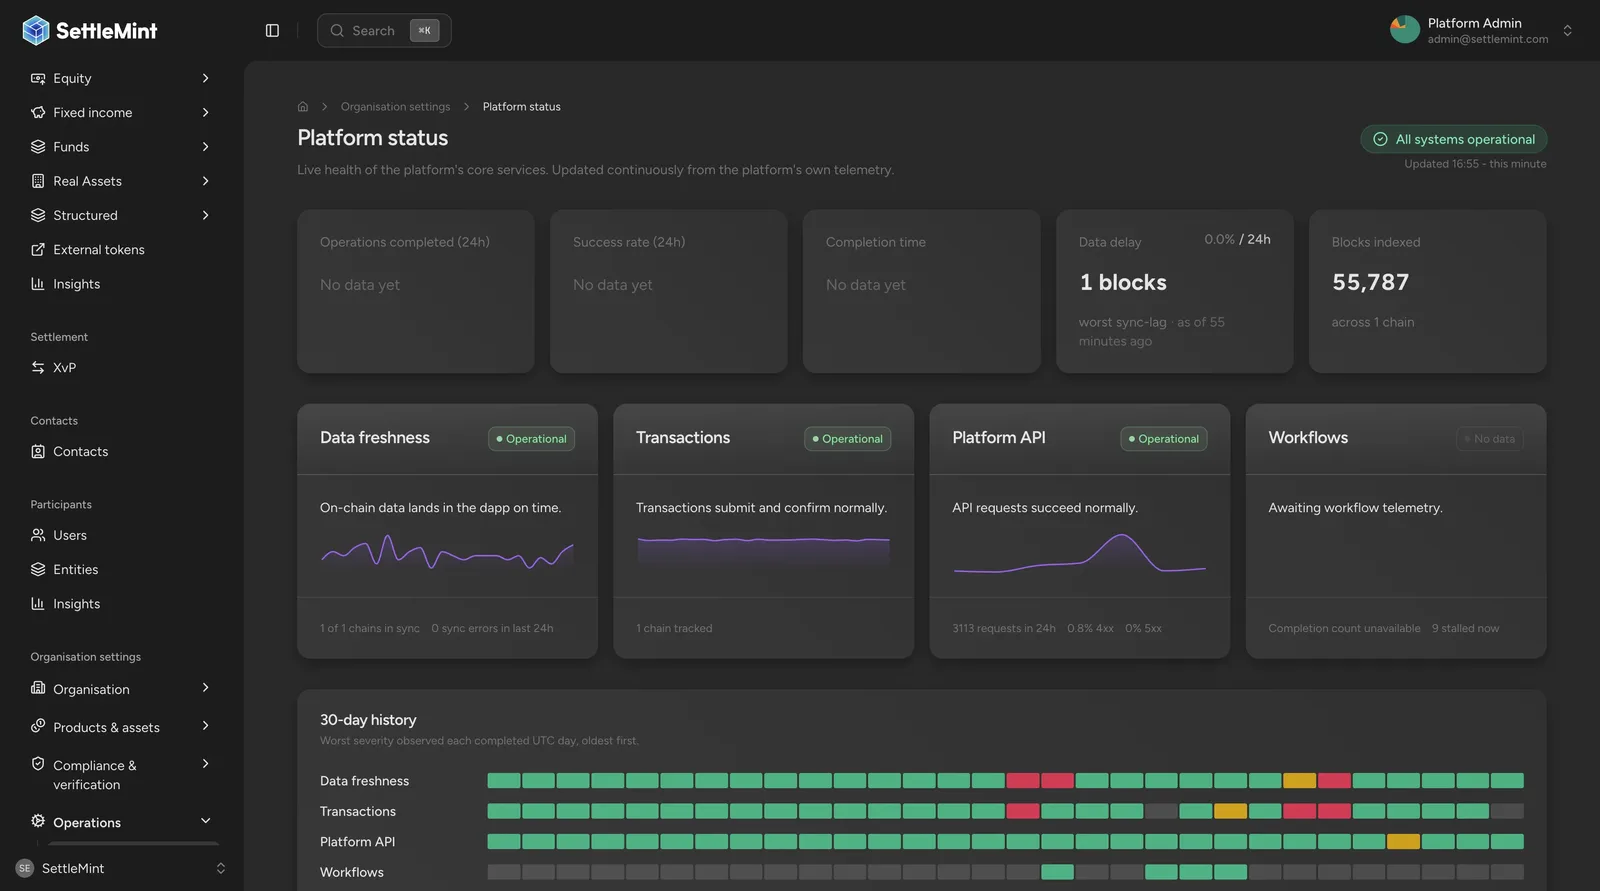
Platform Status combines API, transaction, workflow, and data-freshness signals. Open a panel to inspect the signal behind an operational, degraded, or outage verdict.
API health, chain health, and a rollup verdict now live inside the product, in terms an operator acts on
API health, blockchain health, and a rollup verdict now live inside the product, expressed in terms operators act on. Leave the infrastructure dashboards for when you need them. The signal that matters is already here.
- Layers
- API, chain, status
- View
- One rollup
- Alerts
- Threshold-based
- Context switch
- None
Knowing whether the platform was healthy used to mean leaving it. You would open a separate infrastructure dashboard, find the right panel, translate what it said into something you could act on, and then return to the product. For a team running digital assets under operational SLAs, that round-trip is slow and easy to miss.
The problem is not a lack of data. Any modern deployment generates plenty of metrics. The problem is that the data lives in the wrong place, expressed in the wrong terms, for the person who needs to make a call. An on-call operator managing a redemption window does not need a Prometheus graph. They need one answer: can operations proceed right now?
In DALP 3.0, Platform Status gives them that answer directly, as a built-in view rather than a link to something outside the product.
Three layers, one view
Platform monitoring is structured as three layers that compose into a single verdict.
- 1API Monitoring
Request volume, endpoint health, error rates, and trends across every Platform API call your operators and integrations make.
- 2Blockchain Monitoring
RPC health, indexer state, sync lag, service health, and empty-block periods across every chain you run on.
- 3Platform Status
A single operational / degraded / outage rollup that aggregates both layers, with per-panel detail for the signals driving each state.
Each layer stands on its own. Together they answer the question an on-call operator actually faces: not "is the infrastructure up?" but "can my asset operations proceed right now?" without leaving the product to stitch together signals from three separate tools.
The three-layer structure matters because each layer covers a different scope at a different timescale. API Monitoring reads from the top: are requests succeeding? Blockchain Monitoring reads from the bottom: is the underlying network in a state where new transactions can make progress? Platform Status combines both. Given everything each layer reports right now, is this system safe to operate on?
An operator with access to only the API layer might see clean success rates while the chain they settle on has been stalled for eight minutes. The composite view closes that gap.
API monitoring
The Platform API is the boundary between your operations and everything the platform does on their behalf. Transfer instructions, compliance checks, and workflow triggers all pass through it. When something goes wrong in your integration or in the platform itself, the API layer shows it first.
API monitoring gives you a live read on how that boundary is behaving under real traffic. Request volume, endpoint-level health, error rates, and trend lines are all visible without leaving the product. If a spike of 4xx responses appears, or a workflow path starts timing out, you see it in the same place you manage the assets it affects.
The view covers your full API surface: requests the operations team makes through the console, traffic integrations send programmatically, and calls the platform makes on its own behalf. All grouped by endpoint so the pattern is immediate.
How verdicts avoid false signals
The verdict logic behind each endpoint panel is calibrated to avoid false signals on both busy and quiet days.
At high traffic volume, an outage verdict requires the 5xx rate to exceed 5% of total requests. That is enough to identify a systemic problem without triggering on isolated client errors.
At low volume, percentage thresholds break down. A single failed request on a quiet afternoon represents 100% failure by math, but says nothing meaningful about system health. Below 500 daily requests, the panel switches to an absolute count. Fifty or more 5xx responses flag an outage regardless of the day's total volume. If the day produced no traffic at all, the panel returns a no-data state rather than inferring health from silence.
Thresholds are consistent between the day-level summary and the live snapshot, so the verdict at 9am matches the one the same panel would have shown last night.
This matters most when a problem is localized rather than global. A misconfigured integration producing 4xx errors in volume shows up in the per-endpoint breakdown before it becomes a user-facing incident. A sustained spike of 5xx responses on a single route points to a specific surface area rather than forcing a full triage pass. The trend line makes clear whether you are watching a new problem develop or the recovery tail of something that already peaked.
Blockchain monitoring
Running digital assets means taking operational responsibility for the chains they live on. A block stall, a degraded RPC node, or an indexer that falls behind the chain head can each silently affect whether transfers settle, compliance reads are current, or a scheduled redemption can proceed. The failure mode is subtle: the API layer may return clean responses while the chain underneath is in a state where no new transactions can land.
Blockchain monitoring answers the question most infrastructure dashboards handle poorly for an asset operator: is the chain actually usable right now?
- Navigate to a separate infrastructure dashboard outside the product.
- Find the right panel for the chain you are concerned about.
- Translate raw RPC metrics into whether your asset operations are affected.
- Repeat for every chain you run on.
- RPC health, indexer state, sync lag, and service health in one panel per chain.
- Empty-block periods flagged against thresholds calibrated to each chain's normal cadence, in operator terms.
- All chains you run on, side by side, without leaving the product.
- The platform's own OpenTelemetry export and the Ledger indexing stalled runbook are the path for deeper investigation.
Block progress
A block with no transactions still indicates block production. Check block timestamps and chain-head progress to distinguish a quiet network from a stalled one. Compare RPC health and indexer lag before deciding which service needs intervention.
Indexer sync lag
Blockchain monitoring also surfaces indexer state and sync lag. The Ledger Index needs to stay close to the chain head for historical queries and compliance reads to be current. Sync lag gives you a live measure of how close it is.
Sync lag is measured two complementary ways. The time delta shows how far behind the latest indexed snapshot sits relative to the current wall clock, expressed in seconds. The depth count shows the number of unprocessed entries the indexer has yet to clear before it reaches the head. Both are visible in the per-chain panel.
Block lag and time lag describe different quantities. Many recent blocks can represent a short delay on a fast chain; fewer blocks can represent a longer delay on a slow chain. Compare both against the network's expected block interval.
Platform Status
When you are responsible for a live book of digital assets, uncertainty is not just an inconvenience. Every unanswered question is a decision made without enough information. Do you hold a redemption window open or close it? Do you page the on-call team or wait another minute?
Platform Status is designed to remove that uncertainty. It reads signals from both API monitoring and blockchain monitoring and surfaces one of three states: operational, degraded, or outage. Operational means all monitored services are within normal bounds. Degraded means something is outside bounds but operations can continue. Outage means transactions cannot progress. That warrants intervention, not "check back later."
Four panels, one rollup
The rollup is panel-driven, with four independent views:
- Data freshness: indexer sync state and data currency across chains, including sync error counts for the last 24 hours.
- Transactions: in-flight and recent activity across the chains you operate on.
- Platform API: request volume, 4xx rate, 5xx rate, and endpoint health over the last 24 hours.
- Workflows: engine health and queue depth, including stalled workflow count.
Each panel computes its own verdict. The overall status is the worst state any panel is in: if three panels are operational and one reports an outage, the rollup reflects outage. The driving signal is always visible.
Each state links to the per-panel detail that drove it. One click shows which signal crossed its threshold. Panels load independently, so a slow query against one data source does not hold up the others. A panel that fails to load shows a no-data state while the rest of the view remains usable. Reload to request a fresh reading, then inspect the affected service if data still does not arrive. Platform Status itself does not poll on a fixed interval; it reads live on every page load.
Querying platform status from an integration
The per-panel design also matters for how you consume Platform Status from an integration. Each panel has its own endpoint. An integration that monitors for degraded or outage states can query only the panel it cares about. The /platform-api endpoint returns the verdict for API traffic. The /data-freshness endpoint returns indexer sync state. An integration that only cares about whether the chain an asset lives on is keeping up with the head does not need to wait on a workflow-engine query unrelated to its concern.
Use deployment observability to export traces, metrics, and logs to your monitoring backend. The Ledger indexing stalled runbook helps distinguish a stalled chain from one that is still catching up.
Compatibility / migration
The snapshot route that previously served all Platform Status data in a single response is deprecated in DALP 3.0. Each panel now loads through its own endpoint under /api/v2/platform-status: /data-freshness (indexer sync state across chains), /transactions (transaction infrastructure health), /platform-api (request volume with 4xx and 5xx rates), /workflows (workflow engine health and queue depth), and /stat-cards (summary operational metrics). The API explorer documents the request and response shape for each, under the v2-platform-status tag.
The previous snapshot endpoint (/api/v2/platform-status/snapshot) still answers requests, but every response carries a Deprecation: true header and a published Sunset date. To migrate, replace calls to the snapshot endpoint with the per-panel endpoint that returns the data your integration consumes. Per-panel endpoints are faster: they load in parallel, so a slow panel no longer delays the others.
Webhooks
HMAC-signed delivery with exponential retries and optional counter-signed receipts means every settlement, approval, and deployment reaches your systems.
Self-managed upgrades
System updates compares your deployed components against the on-chain directory and upgrades every out-of-date implementation in one guided run.